If you’re new to the world of Google Ads, you may be wondering just how much budget to set aside for your campaign. Below, you will find anova’s Google Ads Performance Calculator to see the Cost Per Click and Click Through Rate for each industry.
Sadly, there’s no one-size-fits-all answer when it comes to pay-per-click (PPC) activity. The cost of Google Ads (once known as Google AdWords) depends on multiple factors. In this article, we’ll provide an overview of the types of questions you’ll need to ask yourself when building your campaign, as well as some tips on how to set a realistic budget for your Google advertising.
Use our Performance Calculator-
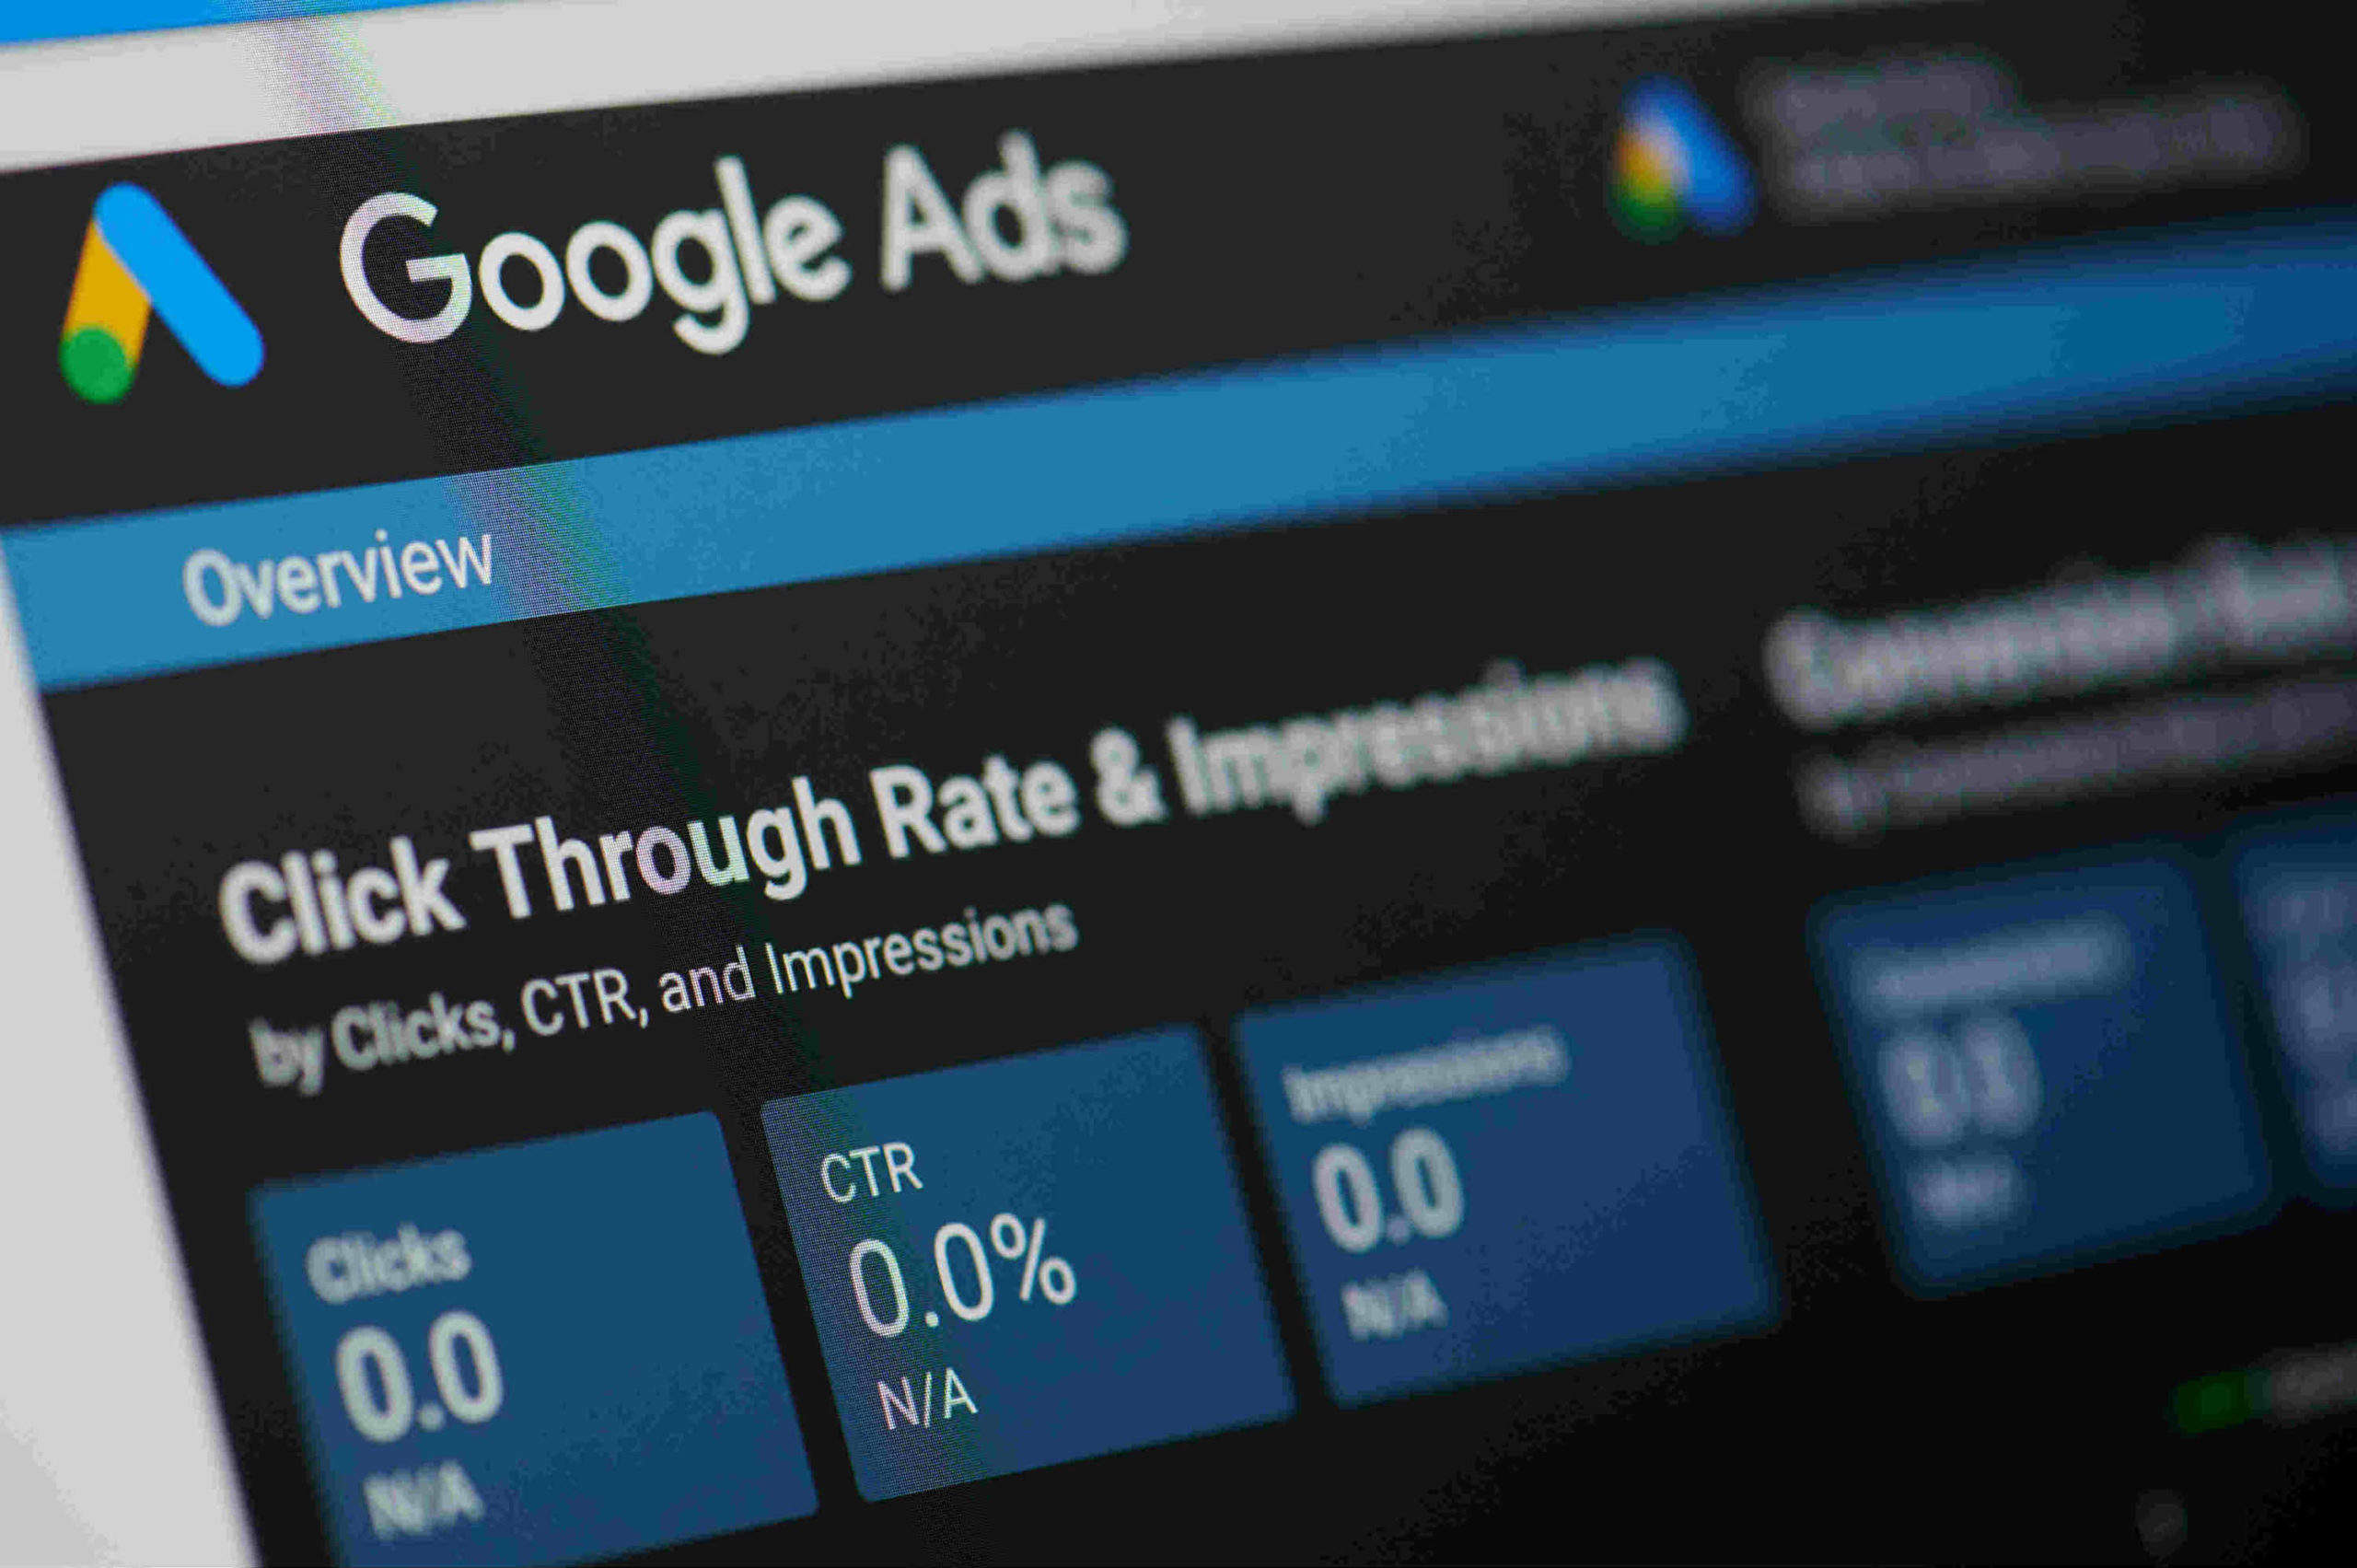
Click-Through Rate (CTR)Clicks / Impressions
-
Conversion Rate (CVR)Conversions / Clicks
-
Return On Advertising Spend (ROAS)Revenue Generated / The amount you spent on your adverts
-
Cost Per Click (CPC)The amount you spent on your adverts / Clicks
-
Cost Per Action (CPA)The amount you spent on your adverts / Actions
-
Cost Per Conversion (CPC)The amount you spent on your adverts / Conversions
Note: These 2019 Google Ads industry benchmarks are from PPC Software company WordStream.
Simply enter in a few key metrics such as your budget, revenue generated, the number of impressions, reach, conversions and clicks, and we’ll provide you with a detailed report on how your campaign is performing against other similar businesses.
How do Google Ads work?
Simply put, Google Ads are the paid-for listings you see at the top of the search engine results pages (SERPs).
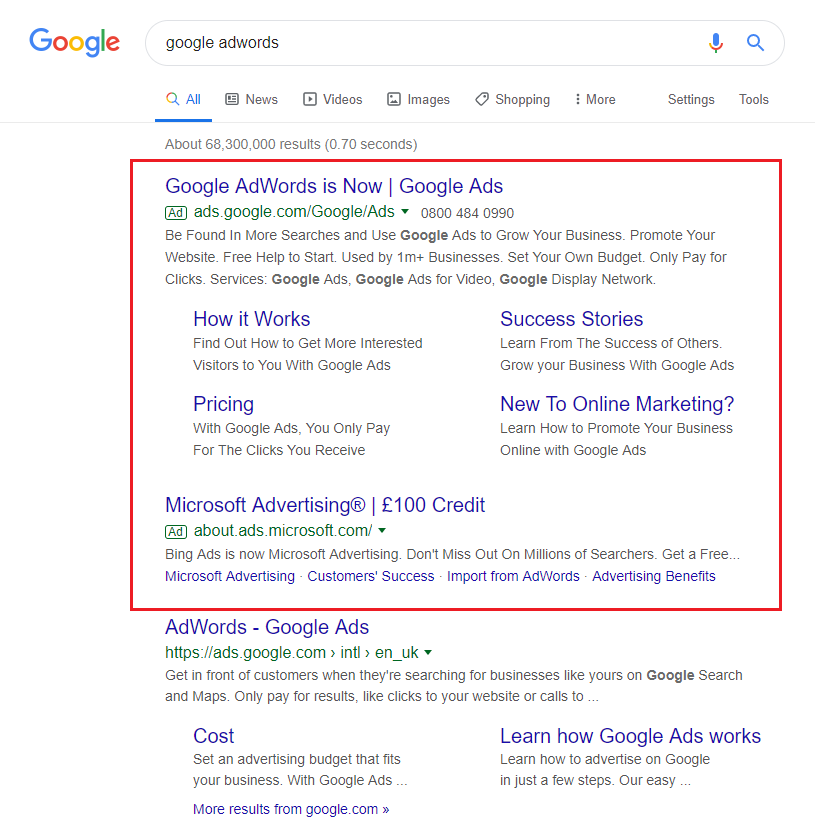
For example, if you type ‘Google Adwords’ into Google’s search bar, you’ll likely be served a couple of ad listings at the top of the SERPs first, before the organic listings appear beneath them. Google Ads are identifiable thanks to a little green ‘Ad’ icon that appears to the left of the search result.
Google Ads is a bidding framework that basically remunerates advertisers which have very much considered quality content.
If multiple advertisers have bid on the same or similar keywords to the user’s search query, the auction starts. At this point, Google will decide your ‘Ad Rank’, AKA where each ad will be positioned in the SERPs (or whether the ad will even appear at all). Google does this by analysing your maximum CPC bid and your campaign’s quality score. The quality score is determined by the ad’s ‘usefulness’ to the user – its relevance, ease of use, keywords position in the ad, quality of landing page, and so forth.
See how your Google Ads compare to other industries
It’s understandable to feel a little overwhelmed with Google Ads at first. There is undoubtedly a vast amount to learn to get the best ROI for your budget. Use the above tool as a Google Ads Cost Calculator to work out your search advertising budget and to see how you compare with other industries.
While there is certainly value in reviewing the activity of similar businesses within your industry, a lot can be learned from analysing your previous search campaigns. To get the best ROI, keep testing. Experiment with different ad variations and landing pages to improve your results.
Check your latest campaign’s performance and get up to date industry benchmarks using our Google Ads Performance Calculator.
Here’s what you can do to get the best out your PPC budget:
- You can use the Google Keyword Planner to find out how much keywords cost if you’re not running any ads.
- If you are already running campaigns, you can use your campaign data (impressions, CPC,) to get an industry benchmark report.
See how much budget you need in Google Ads
Google Ads Cost Benchmarks 2019
As of Q2 2019, the average cost per click (CPC) on Google Ads is between £0.66 and £1.32. However, the most expensive keywords in Google Ads can cost more than £50 per click. Ouch!
In the UK, the most expensive search CPCs are found within highly competitive industries.
Below is a breakdown of average CPC (search) by industry.
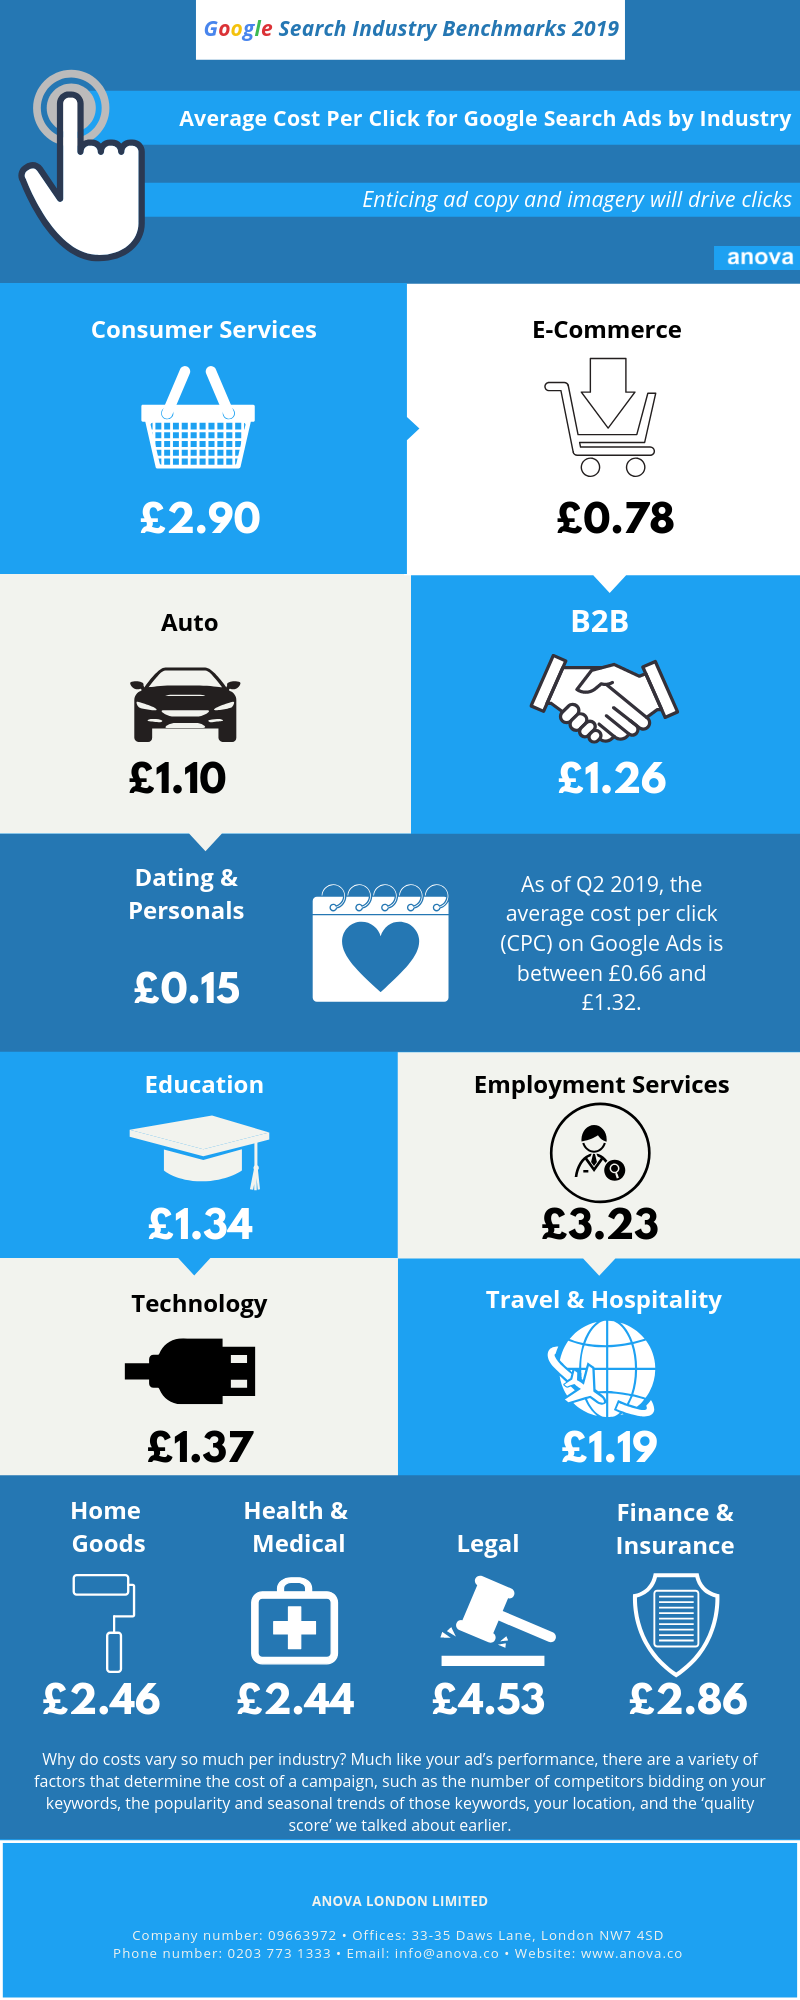
Why do costs vary so much per industry?
Much like your ad’s performance, there are a variety of factors that determine the cost of a campaign, such as the number of competitors bidding on your keywords, the popularity and seasonal trends of those keywords, your location, and the ‘quality score’ we talked about earlier.
The good news is that advertisers have tight control over how Google Ads budget is spent. A seasoned digital marketing professional will know how to set your ad campaign’s schedule, geotargeting, device targeting, and ad copy to make sure you’re not paying over the odds for your Google Ads campaign.
How to improve your Google Ads performance?
Those new to PPC should be careful not to assign too much budget when starting out – newcomers may find their Google Ads budget gets spent way faster than anticipated.
Instead, we recommend allocating a fairly small amount of your overall monthly advertising budget to Google Ads and being specific about how much each campaign should be spending each day. This method allows advertisers to be completely in control of their advertising spend. If you’ve never run a Google Ads campaign before, we suggest setting this limit at 10% as you get to grips with the system, to avoid overspending.
Once you’ve determined your advertising budget for the month, you’ll need to start thinking about your keywords. Do some research into the types of things your customers are searching for, and base your keywords around that. Try to be as specific as you can – after all, the more relevant your keywords are, the better your ad will perform.
Another way to boost your search Google Ads campaign’s performance is to improve your landing pages. Ensure they are as relevant as possible to the keywords in your ad group, even if this means having several similar ad groups within the campaign. Think about the content on your landing page – does it match up to your ad copy? How useful would the page be to your user?
There are loads of ways to improve your landing pages, from adding better product descriptions and enticing imagery to video and even product reviews. Take it one step further and optimise those pages based on the action you want your ad to drive. For example, if it’s conversions you’re measuring, make it super easy for your customers to navigate checkout.
A common mistake is to set your geotargeting too wide. Geotargeting allows you to pick and choose where your ads are served, whether that’s an entire county or just a few streets local to your store. This is particularly useful for businesses with bricks-and-mortar premises. A popular misconception is that setting a wider area will allow more people to see your ads and seek out your business. This is a sure-fire way to burn through your budget fast and reduce the effectiveness of your campaign. Instead, be just as specific with your geotargeting as you were when setting your keywords.
Calculating your Google Ads PPC budget
Once your marketing experts know the answers to this question, you can do some basic calculations to help you figure out a PPC budget. Here’s an example of how that calculation might work:
If you need 250 new customers in a month and your close rate is 15%, then you need a PPC lead goal of 1667 conversions per month to turn 15% of them into 250 leads. If your cost per lead is £25, you’ll need £41,666.67 per month to drive that many leads and clients, or £1388 per day.
You can use our Google Ads Performance Calculator above to work out campaign budgets and goal scenario or to keep up to date with the latest Google Ads industry benchmarks in 2019.
What about Google Ads conversions?
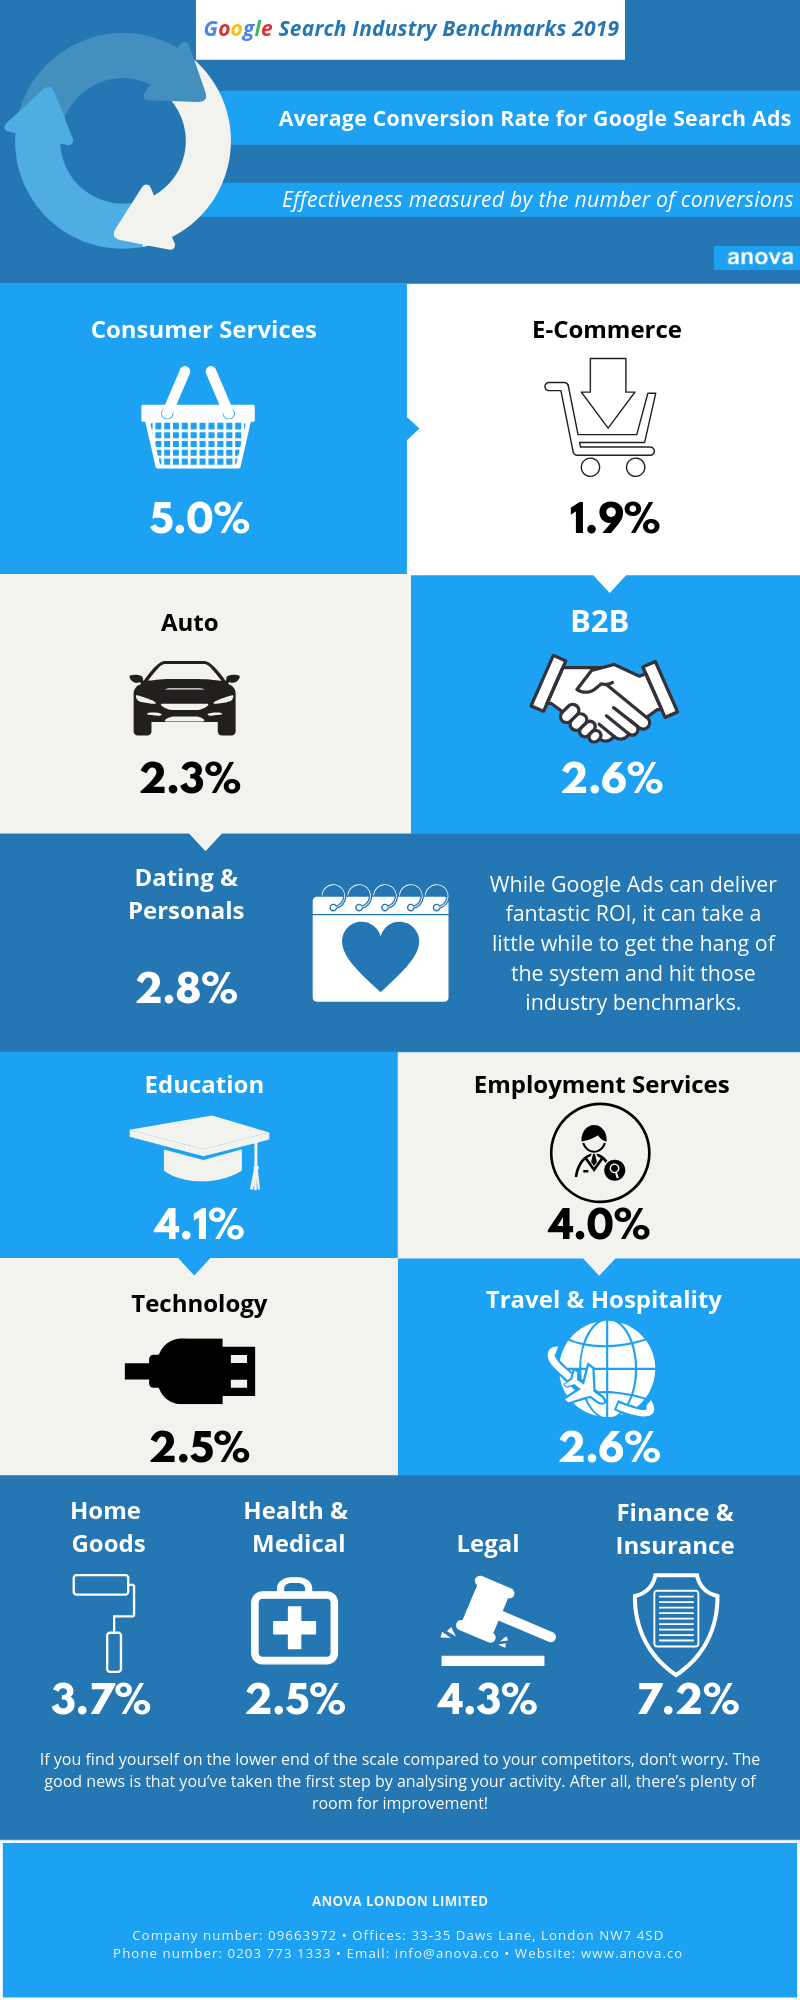
Just like CPC, there are industry benchmarks for conversion rate, too. While measuring clicks can give you a good indication of how well your ad is performing, ultimately you’ll want to measure the effectiveness of your ad by the number of conversions it drove.
Conversions can be anything you set as a conversion goal, whether that’s sales, newsletter sign-ups, or downloads.
In Google Ads, conversion rates are determined by dividing the number of conversions your campaign received by the number of clicks on your ad.
Below is a breakdown of Google Ads’ (search) conversion rate by industry
Boost your Google Ads Performance
If you find yourself on the lower end of the scale compared to your competitors, don’t worry. The good news is that you’ve taken the first step by analysing your activity. After all, there’s plenty of room for improvement!
Even if you’re hitting those Google Ads benchmarks, why stop there? Always strive for better by writing the best ad copy, hyper-targeting your ads and optimising those landing pages to convert better than anyone else in your industry.
Gain the upper hand with your next Google Ads campaign
While Google Ads can deliver fantastic ROI, it can take a little while to get the hang of the system and hit those industry benchmarks. As we’ve highlighted in this article, there are many facets to master when it comes to building PPC ads that genuinely deliver.
If you want to see immediate results – who wouldn’t? – we recommend working with an experienced PPC specialist to design relevant, tailored ad campaigns guaranteed to perform for your business.
Here at anova, we specialise in helping businesses thrive by enhancing their online presence. Our team of digital marketing Google Ads experts are on hand to help you design ad campaigns that work. We’re a Google Ads Partner, so you can trust us to get your campaign off to a flying start.
Add the data into the Google Ads Calculator and look into the generated benchmark report. If you want to know more about Google Ads Campaigns, Contact us today!